


With all the snow and excitement of the last few days, we thought we’d offer a quick lesson on how to predict Aussie snow events using a few simple rules.
In our experience, the difficulty is not in predicting when it’s going to snow, but how much is going to fall.
At Snowriders Aus we like to keep it simple. Unlike our cold blooded friends, Snowatch’s Pete ‘the Frog’ Taylor and Mountainwatch’s, ‘the Grasshopper’, we are no experts; but we have been around the mountains long enough to know the difference between a snow-bearing system and a non-snow-bearing system. If you can handle a bit of G-rated science, we offer a few simple rules to get you started as an amateur snow forecaster.
3 simple rules
For us, there are three simple rules, all of which can be phrased as questions. If the answers are yes, yes and yes, then you can bet your life it WILL snow. It’s just a question of how much.
- Is a cold front expected to cross the highlands?
- Is there moisture behind the cold front? and
- Is the cold front riding a wave of cold air?
A classic snow bearing cold front
In the southern hemisphere, the earth’s rotation causes air to flow clockwise around low (L) pressure systems and anticlockwise around high (H) pressure systems. The opposite applies in the northern hemisphere. Low pressure systems, otherwise known as cold fronts, are shown in the synoptic chart below as curved lines with as series of triangles – which look remarkably likes shark’s teeth.
The system below coincidentally follows the path of this week’s monster storm which resulted in widespread snowfalls across New South Wales, Victoria, Tasmania and even parts of South Australia.
The key here is the trajectory of the cold front as shown by the blue arrow in the upper left-hand panel, which shows that the front is moving (spinning) in a clockwise direction, drawing in cold air from the south as it does. The front is not only expected to cross the south-eastern highlands, but because of it’s rotation is carrying with it very cold air from the antarctic region, as indicated by the shape and narrow separation of the parallel lines, otherwise known as ‘isobars’. Narrow separation indicates strong winds, and distant separation low winds (generally speaking). The system below is a very very cold system, as we saw this week. So in this example, we have evidence of not only a cold front but evidence of very cold air, as indicated by south to north orientation of the isobars.
So that’s 2 of the 3 questions covered, but what about the third – moisture?
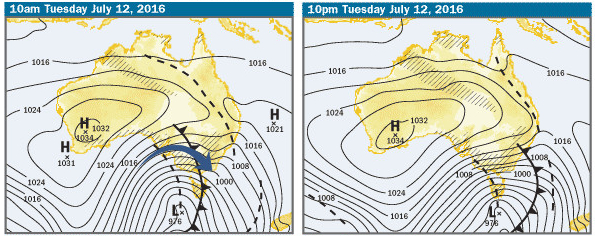
Luckily synoptic charts tell us a little about moisture too. Moisture (which is a catch-all term for rain/hail or snow) is indicated in the synoptic chart by the presence of cross-hatches over the mainland and the broken-lines (or troughs), over the water. A cold front followed by a trough is generally a good thing, as low pressure troughs are often associated with storms and rain. And when its cold, this means snow – and lots of it. The significant snow-bearing system which delivered between 30 and 85 cm across the big-five resorts earlier this week was characterised by both, a front and a trough.
Beyond our 3 simple rules – predicting snowfall amounts
While synoptic charts provide most of what we need to forecast snow events, there are of course many other sources of information. Once you’ve answered ‘yes’ to the three questions above, charts like the MSLP ‘pressure/thickness/rainfall’ chart below can be used to determine the amount of snow. In this example, between 5 and 10 ml of rain are predicted for the south-eastern corner of the continent. With 1 ml of rain equating to around 1 cm of snow, this translates to at least 5 cm of snow, and perhaps more under colder conditions, when snow tends to be lighter and drier (i.e. resulting in lower density and greater snowflake volume). This of course is a massive simplification; far far more analysis is required in order to deliver more accurate forecasts, especially at finer spatial scales, including those for individual resorts.
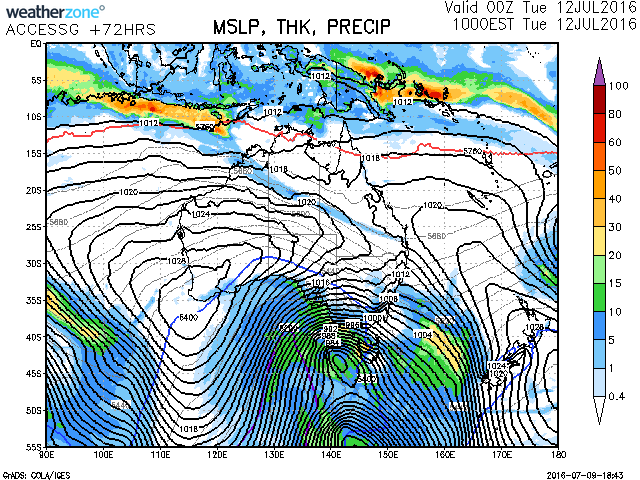
Another interesting and useful feature of the MSLP charts are the ‘thickness’ lines, represented by the red, blue and purple unbroken lines. Thickness is just a technical term for the temperature of the air masses. The blue 5400 line is most relevant when predicting snow fall. The 5400 line generally divides polar air from mid-latitude air and is used as a guide to whether the predicted moisture will fall as rain or snow. Regions inside the 5400 will generally produce snow; regions outside the line are less likely to experience snow. The example above shows the south-eastern highlands sitting well within the 5400 line, making for a near perfect scenario.
So noting everything we’ve said above, what we experienced earlier this week was close to the perfect snow-bearing system. There was a cold front followed by low pressure trough, and the front and trough brought with them significant amounts of moisture sitting within a very cold air mass.
So there you have it, three golden rules for predicting snowfall events based on fronts, cold air and moisture. With these simple rules, you’ll be predicting the probability of and perhaps even the amount of snow-fall in no time at all. And with a bit of practice, maybe one day you’ll rival our friends the frog and the grasshopper.
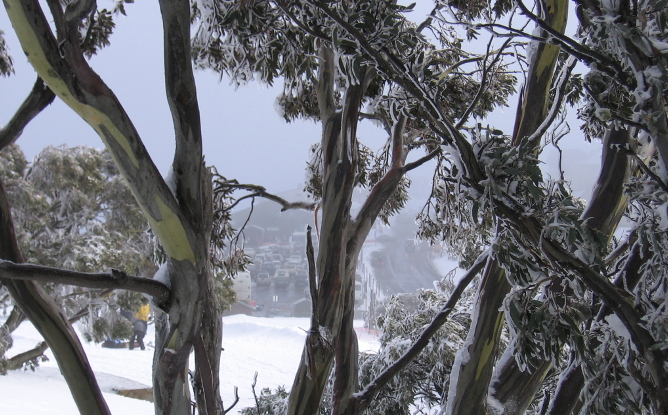
Photo: The Adventure Company
